So the original idea of this post was to document how I fed accession locality data into two new online mapping tools I had recently run across, and then maybe even mashed up the results. It didn’t quite work out that way, but I did spend quite a bit of time on trying to make it happen, so I want to get some kind of blog post out of it anyway. So here goes.
The two new tools are:
- The Global Accessibility Mapping Interactive Accessibility Tool. This enables the user to create a map showing travel time to a set of points of their choice.
- Crop-Climate Suitability Mapping. “A continuously updatable crop suitability geovisualization application for locating the fundamental climate niche of select crops across geographies and temporal scales.”
My thought was to get a bunch of localities for landraces of a crop from Genesys, plug them into the accessibility tool, and then compare the output of that with the overall suitability map for the crop in the region in question. Result: areas suitable for the crop but far from locations of current genebank accessions. That is, priorities for further collecting. Or at least one possible approach to prioritizing collecting. 1
The first bit was easy enough. I got locality data on barley accessions from Yemen out of Genesys, fiddled with the CSV file a bit, uploaded it into the accessibility tool, ran it, and eventually downloaded a GeoTIFF, which you can upload into Google Earth.
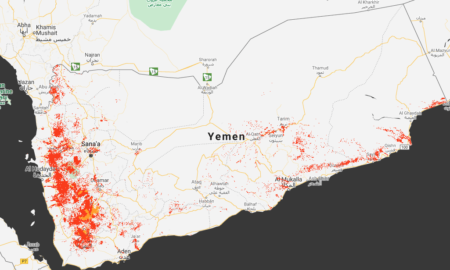
The next step was not so straightforward. I was just not able to get a sensible map for barley in Yemen out of the Crop-Climate Suitability Mapping tool. And I did try. A lot. All I got was the whole of Yemen being classified as “pessimal” for barley, which can’t be right. “Max agriculture extent” was not bad, but no amount of fiddling with the parameters allowed me to produce a mad showing where barley might be expected to grow within that area. But even if I had succeeded, it was not clear to me how I could have used the results outside the confines of the tool itself. There’s no way to download the map, that I could find, apart from a screenshot like this one, which just shows that wherever there is agriculture in Yemen is abysmally bad for barley (red means “pessimal”, orange merely unsuitable).
But having invested quite a bit of time already, I decided to fall back on SPAM. The Spatial Production Allocation Model is still the go-to tool for crop suitability mapping, it seems. And the maps you can make online, such as this one for barley, are nice.
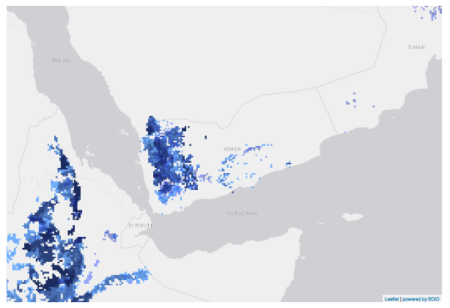
There’s not much more you can do with this, though. You can map accessions from Genesys from the same menu, though not, alas, on the same map as the suitability results. However, SPAM does also provide downloadable data for barley, which comes as part of a huge bunch of global GeoTIFFs. I uploaded that into Google Earth along with the accessibility map.
Here’s what I got.
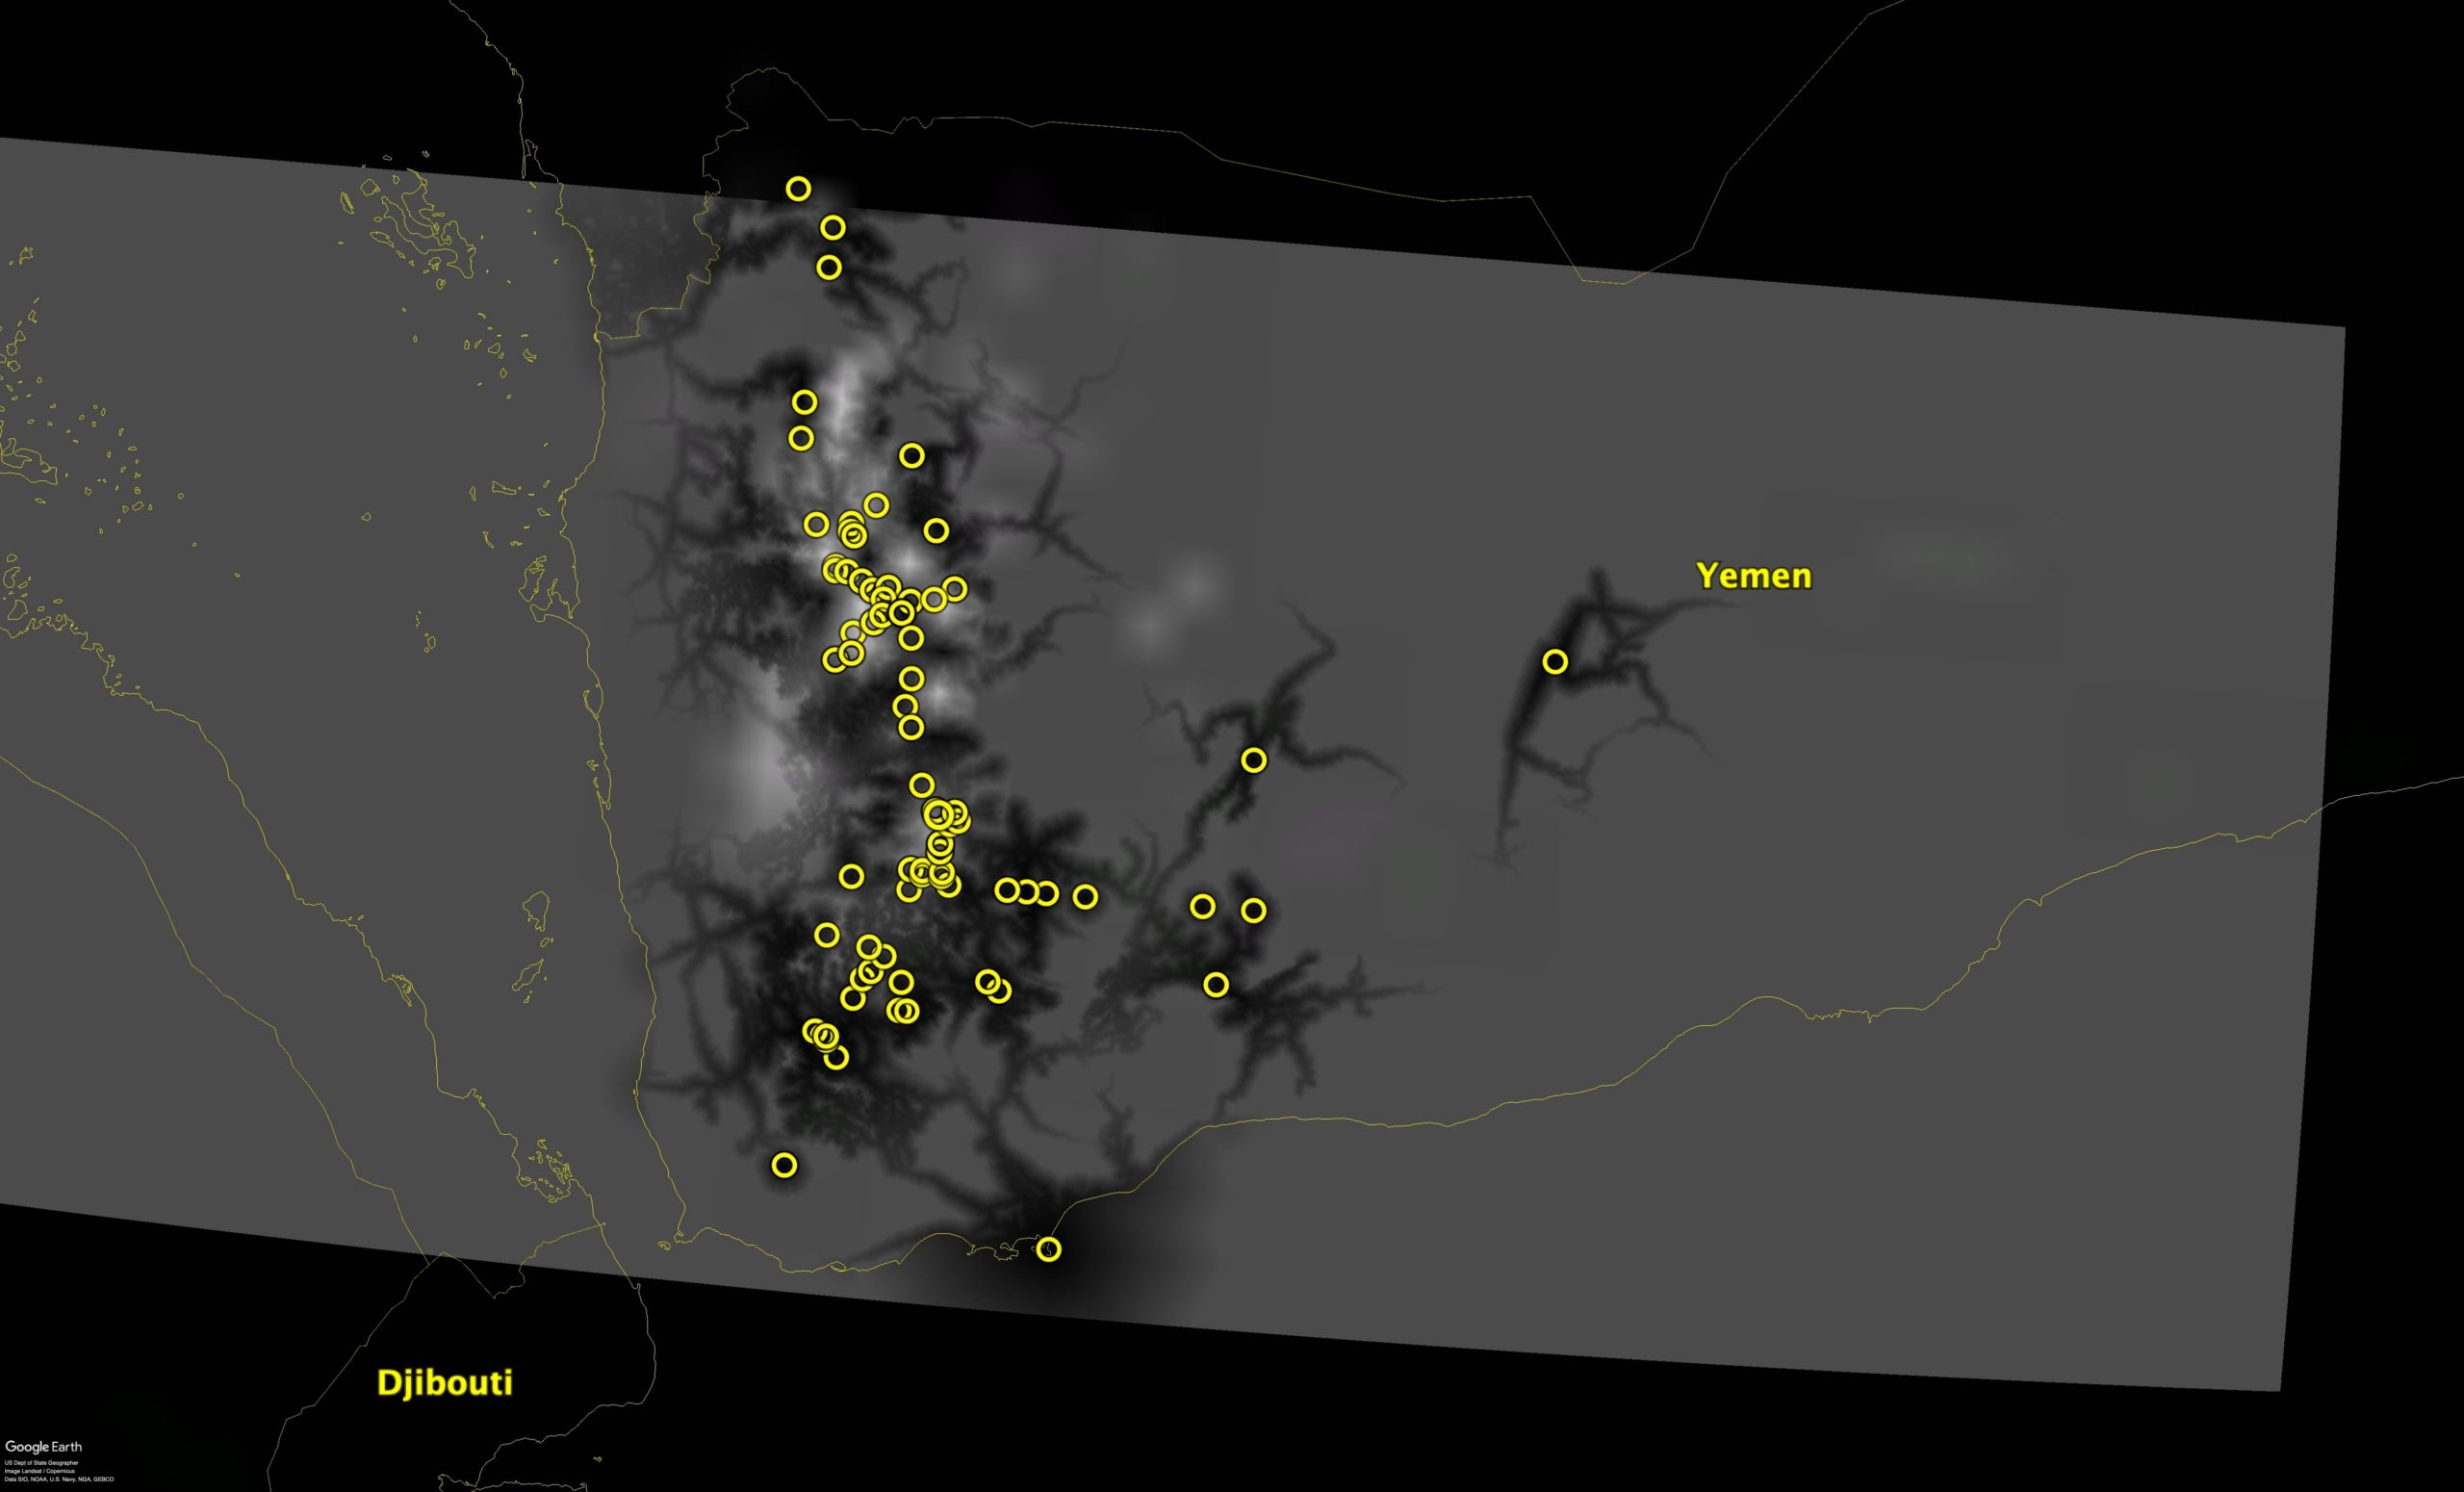
Ok, not great, I admit. The colour from both the accessibility and SPAM results disappeared when imported in Google Earth, so now suitability is the lighter colour and accessibility the dark streaks. I’ve overlapped the layers so that if you see any light colour, that shows places which are suitable for barley but relatively inaccessible from the locations of other barley accessions (the yellow circles). Those could be your priority collecting localities, in other words.
So not great, but not bad either. At least as a conversation starter. So don’t let me down, start a conversation below…
- Here’s an infinitely more sophisticated approach.
I have to say that whereas the crop-climate suitability mapping tool from my friends at Lansing is a great idea (which surely will continue to improve with time), I also struggled to get it to produce sensible results. In fact, their own example with beans in the paper that describes the tool also shows results that don’t quite match what you expect from an eco-physiological perspective.
There are alternative ways of mapping crop suitability, for example with the Wallace modeling package, but that requires installing R. The interface is pretty easy to use, though and you can upload your own occurrence points, select the predictor variables, and a whole bunch of stuff that helps fine tune the models.
In the case of Yemen it seems like SPAM may be a good starting point. However, how can you tell that the areas distant from the existing collections would indeed grow traditional landraces and not, for instance, modern/improved varieties?
And, another question, what is the guarantee that the already-collected accessions still represent what those farmers grow (if indeed they grow landraces). Should we think about revisiting some of those sites? And if so, which ones?
I’m sure that satellite imagery will soon be able to distinguish landraces from modern varieties in the field :)
Thanks for sharing your research Luigi!
This approach in pinpointing landrace origin is one thing requestors of our genebank accessions here in Australia have been increasingly inquiring about. Collating all the collection data buried in notebooks and spreadsheets is still something I’ve trying to find time to do. Hopefully down the track we can work together to establish a comprehensive map of all landrace accessions in our global genebanks.
The Genebank Platform has been working on something along the lines you describe. The methodology is described here and is very much more sophisticated than what I tried in the blog post. Stay tuned for a global analysis across crops…