A big thank you to Colin Khoury, Julian Ramirez, Chrystian Sosa, and Dan Carver for this guest post, reminding us of the history of conservation gap analysis work at CIAT and other CGIAR centres during the past decade and more.
Maps have helped people find their way for at least 2500 years, so it’s no surprise that geographic methods have been part of the portfolio of tools used to try to understand patterns and distributions of crop diversity, and, more recently, crop genetic erosion, ever since these topics began to garner the interest of scientists and conservationists. Innovations in digital mapping tools, made possible by developments in computer processing and the internet, have enabled continual leaps in the power and efficiency of such methods throughout the past few decades.
CGIAR embraced geographic information system (GIS) research tools about as soon as they were developed. At the International Center for Tropical Agriculture (CIAT), the International Potato Center (CIP), the International Plant Genetic Resources Institute (IPGRI, now Bioversity International), and the International Rice Research Institute (IRRI), among others, scientists began to apply available GIS tools to genetic resources conservation, and then develop their own suite of methods, programs, and datasets, often in collaboration with national partners and academics (e.g. wild potatoes, peanuts, chile pepper, and peanut/potato/cowpea, as well as climate data). Some of these developments, such as FloraMap and DIVA-GIS (and more recently CAPFITOGEN, by other researchers), have been aimed at making these tools easier to use by those in genetic resources community without extensive GIS experience: an important effort toward greater accessibility, even if it has met with mixed success.
By the 2000s, crop wild relatives were gaining attention as important genetic resources for crop breeding, and would soon be specifically targeted for conservation both by the Convention on Biological Diversity (CBD’s Aichi Target 13), and the Sustainable Development Goals (SDG Target 2.5). It was increasingly important, therefore, that conservation research tools were applied to these useful wild plants, and fortunate that the groundwork for GIS applications had already been laid by a decade or so of research. Through the second phase of a cross-CGIAR initiative called the Global Public Goods Project 2 (GPG2), run from 2007-2010, the distributions of the wild relatives of ten CGIAR mandate crops were mapped, with priorities for further collecting for ex situ conservation identified.
A major milestone of that project was the publication of a “gap analysis” methodology for the ex situ conservation of crop wild relatives, which made use of biodiversity (e.g. GBIF) and genebank (e.g. CIAT) collections data available online, as well as some the most recent advancements in species distribution modelling (i.e. MaxEnt) and climate data. A big question at the time (and still now) was how well these methods stood up against field-based expertise. The researchers devised an evaluation tool to assess human versus machine — in this case one of the world’s foremost experts on wild bean diversity versus the gap analysis tool — in a John Henry-esque battle conceived in the context of the sad truth that the world is losing field botanists much faster than producing new ones, and that machine power may potentially mitigate (some of) that loss. While the result of the man vs. machine experiment couldn’t be compared to IBM’s Watson breakthrough win at Jeopardy!, it did demonstrate the potential of the use of lots of data and computation to inform conservation planning.
This gap analysis methodology was applied at a much larger scale through the 2011-2021 Crop Wild Relatives Project (website here), assessing ex situ conservation gaps for over 1000 crop wild relative taxa related to about 100 crops, and including a long list of experts to evaluate the results. The collaborations with taxonomic, plant breeder, and conservation colleagues also resulted in a number of gap analyses specific for crop genepools (i.e. for the crop wild relatives of eggplant, lettuce, pigeonpea, potato, sunflower, and sweetpotato) and geographic areas (e.g. Australia). These provided further opportunities to advance the methods.
During this time the researchers began to think about how the gap analysis tool could have wider application, in particular to contribute to the indicators used to measure global conservation targets on crop diversity, including the CBD’s Aichi Target 13 and SDG Target 2.5. To do so, the tool would need to expand not only taxonomically, but also in conservation scope, by finding a way to assess gaps in the protection of crop diversity in situ. With support from the Biodiversity Indicators Partnership, expanded methods (although still limited to wild plants) were developed (website here) and the gap analysis became an official indicator for Aichi Target 13.
Once the in situ conservation gap analysis methods had been added to the ex situ tools, a flurry of new collaborations on crop wild relatives developed, this time with substantial support from the USDA’s Agricultural Research Service, again focused on crop genepools (i.e. chile peppers, pumpkins, and sorghum) or genepools in certain regions (i.e. carrot and lettuce), but also geographic areas (e.g. USA). This research again enabled us to improve the methods, data sources, and the products, including by adding interactive result documents (e.g. here for CWR of the USA).
We’ve always aimed to make our data, methods, and tools openly available for use, mainly by placing the resources in repositories such as Github, and these have supported colleagues’ research, for example on wild bananas. But recently we decided it was high time to take further steps to make the gap analysis even more accessible and more widely known. Given the interest the methods have generated, and which continues in the present with quite a lot of collaborations, we think that one of the best contributions we can make to the evolving field is to pass the methods on so that more researchers can make more use of them. This is especially true as we are continually challenged by lack of funding and staff, which limit our ability to directly collaborate as much as we would like to.
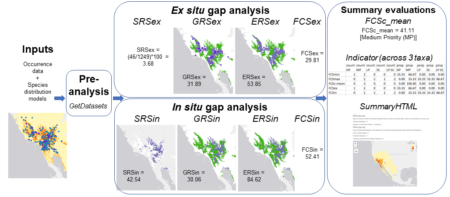
And this is how we arrived at creating GapAnalysis.R, our first fully published (in a peer-reviewed journal) R code, representing well over a decade of research, and whose roots stretch back over a quarter century. It is entirely open access and can be adapted and built upon, and we plan to curate it into the foreseeable future. We hope that it complements the increasing portfolio of R tools used for conservation planning, for example BiodiversityR, and redlistr.
Looking ahead, we are working on ways to further expand the scope of the methods to cover other forms of biodiversity targeted in the major global agreements and important to our own research programs. One of these gaps is for cultivated crop diversity, and here we have started to publish methods that attempt to address the challenges of modelling the distributions of plants whose ranges are determined as much by people as by climate and soils. We have found a way to perform ex situ conservation gap analysis for crops, but assessing the state of in situ (i.e. on farm) conservation presents major challenges that we haven’t figured out how to resolve. Yet. The same goes for gap analysis for livestock diversity, for similar reasons as well as the difficulties in distribution modelling for species that have legs and thus move around, as well as the rather lack of detailed information on the distributions of traditional breeds. Finally, we hope to develop methods to directly integrate genetic data into our ecogeographic gap analysis toolbox, which is a good (but far from perfect) proxy for information on genetic diversity.
The even bigger and more ambitious goal is to find ways by which gap analysis can significantly contribute to resolving persisting gaps in our understanding of crop genetic erosion and its significance to the resilience and adaptive capacity of agriculture as well as to human nutrition and other cultural needs. These gaps can only be resolved by finding ways to conceptualize the full extent of crop diversity, for instance for a given crop in a given region, through baseline documentation of traditional and modern varieties and their wild relatives, both in situ and also ex situ, and subsequently identifying and monitoring those areas and forms of diversity undergoing loss. Quite a big task still ahead of us, and one that certainly we can’t do alone.
We look forward to your thoughts and welcome ideas on collaborations.
Read about GapAnalysis.R at: Carver D, Sosa CC, Khoury CK, Achicanoy HA, Diaz MV, Sotelo S, Castañeda-Álvarez NP, and Ramírez-Villegas JR (2021) GapAnalysis: an R package to calculate conservation indicators using spatial information. Ecography 44. https://doi.org/10.1111/ecog.05430